As thousands of workers start returning to offices in Sydney’s once-bustling city centre, a new dashboard is helping Transport for NSW keep a watchful eye on the public transport network in near real-time.
Introduced at the height of the public health response to the coronavirus pandemic, the dashboard brings together multiple datasets across the department to help ensure strict physical distancing measures can be maintained.
It has been built by the developer behind real-time traffic monitoring website AnyTrip to give decisionmakers a complete view of all modes of transport in Sydney and the surrounding regions, as well as a number of data points visible only to TfNSW.
The dashboard, which builds on a proof-of-concept first designed for New Years Eve, offers TfNSW a single customer-centric view of the transport network to make operational decisions on-the-fly and inform planning.
“The use of real-time data to plan for and implement changes on the public transport and road networks is enabling TfNSW to make smarter and faster decisions to ensure the best outcomes for customers,” customer strategy & technology deputy secretary Joost De Kock told iTnews.
Other areas across the NSW government also have access to the dashboard during the pandemic including the Data Analytics Centre within the Department of Customer Services and the State Emergency Operation Centre.
The initial dashboard was rapidly developed over a two-week period after an initial call to arms in March, though it has been iterated since to incorporate additional datasets.
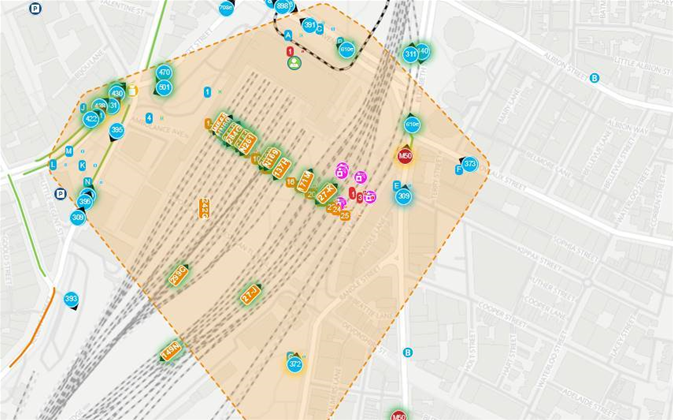
Like AnyTrip’s publicly-accessible tracking map, the dashboard shows the real-time location of public transport services, including trains, buses and the light rail, and their occupancy where that data is available.
On Sydney Trains’ fleet of Waratah trains, which is currently the only rolling stock able to collect occupancy data, patronage is calculated by carriage weight data using in-built sensors under each axle on a carriage.
That data - shown as green, amber and red bars for trains - is also shown on station indicator boards, allowing passengers to pre-empt possible crowding once a service arrives at the platform.
Buses, on the other hand, use data from NSW’s Opal electronic ticketing system to show crowding, which is represented through third-party apps such as TripView, NextThere and AnyTrip using a ‘jelly baby’ system.
In response to the pandemic, data thresholds have been altered to reflect public health guidelines and allow commuters to practice physical distancing on carriages.
Changes to capacity introduced this week have seen these modified to allow for more passengers.
But TfNSW’s iteration of the dashboard goes further, using traffic volume data collected from the Sydney Coordinated Adaptive Traffic System (SCATS), which uses sensors at traffic signals to detect congestion.
It also shows the near real-time location of the 860 cleaners that have been deployed across the public transport network in response to the pandemic using GPS data sourced from their TfNSW-provided devices.
The cleaning crews, as well as the recently introduced social distancing squad and hand sanitiser unit, can also be directed to the busiest locations using real-time data from the dashboard.
The dashboard similarly displays near real-time availability data from parking stations, traffic cameras feeds, special event zones to assist with marshalling and COVID-19 hotspots (if any exist).
Another view, using information that flows into TfNSW’s new publicly-accessible travel insights tool, allows the agency to understand historical patronage data and see year-on-year reductions caused by COVID-19.
This view also predicts patronage for the rest of the day based on last week’s Opal and contactless payments tap-on and tap-off activity, as well as normal (pre-COVID) patterns, which allows citizens to plan their travel outside of the peak.
“By using the travel Insights tool, customers can view data by public transport mode, day or by key commercial centres in greater Sydney and regional NSW to help them plan ahead and understand the latest travel trends,” De Kock said.
He said the travel insights tool, as well as the COVID-19 dashboard, have been made possible thanks to the “groundbreaking” improvements to TfNSW’s technology ecosystem, including using cloud technology to revolutionise how data is collected.
The department has used its Amazon Web Services environment for high frequency data transfer, which has allowed it to reduce lag and access previously unavailable datasets such as from contactless payment tap-ons in real-time.


.jpg&h=140&w=231&c=1&s=0)

.jpg&h=140&w=231&c=1&s=0)

.png&w=100&c=1&s=0)


 iTnews State of Data & AI Breakfast
 SAP NOW AI Tour ANZ
 Forrester's AI Forum Sydney
 The 2026 iAwards
.jpg&w=120&c=1&s=0) Integrate 2026
Integrate 2026


_(1).jpg&h=140&w=231&c=1&s=0)