The FTTN data set offers take-up rates and data on pending orders in 48 FTTN service area modules, mostly in the Newcastle, Lake Macquarie and NSW Central Coast areas of Belmont, Boolaroo, Gorokan, Morisset and Hamilton.
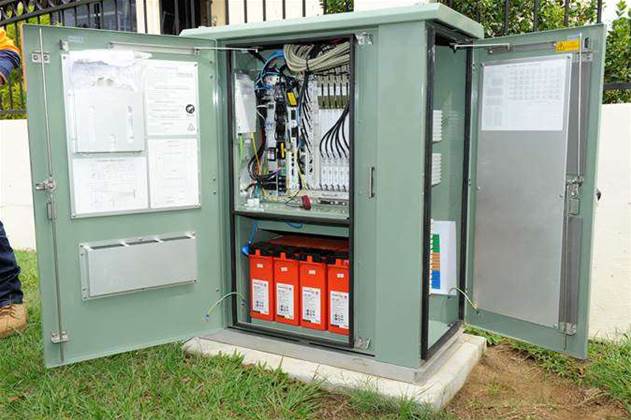
Data is also revealed on FTTN take-up in Bundaberg in Queensland.
The best-performing FTTN area in the dataset is 2BLT-05, which covers the Lake Macquarie suburbs of Floraville, Valentine and Eleebana. It is the only area to have breached 40 percent take-up within six months of being declared ready for service.
However, two FTTN areas are above 40 percent take-up if pending orders are taken into account.
For simplicity, we present and analyse the data by FTTN service area. The data is accurate to March 4 for all NSW sites, and January 22 for Bundaberg.
Belmont (NSW)
Home to the first end-user trial of FTTN technology to 43 homes, there are 10 “2BLT” FTTN areas in the dataset, and they are seeing some of the highest take-up rates among FTTN early adopters.
The median take-up in these East Lake Macquarie suburbs is a shade under 30 percent.
Most were declared ready to carry retail services in November or early December last year.
| Rollout ID | Location | Ready for Service | Total Premises | Activated | Take-up rate (%) | Take-up + Pending Orders (%) |
| 2BLT-01 | Warners Bay | 27/11/15 | 1953 | 593 | 30.36 | 33.1 |
| 2BLT-02 | Warners Bay, Mount Hutton | 27/11/15 | 2251 | 521 | 23.15 | 26.7 |
| 2BLT-03 | Tingira Heights, Windale, Mount Hutton | 27/11/15 | 1937 | 463 | 23.90 | 26.7 |
| 2BLT-04 | Windale, Jewells | 4/12/15 | 2074 | 595 | 28.69 | 32.0 |
| 2BLT-05 | Floraville, Valentine, Eleebana | 4/12/15 | 2767 | 1178 | 42.57 | 45.5 |
| 2BLT-06 | Valentine, Croudace Bay | 4/12/15 | 2217 | 790 | 35.63 | 39.0 |
| 2BLT-07 | Floraville, Belmont North | 13/11/15 | 2785 | 1029 | 36.95 | 39.9 |
| 2BLT-08 | Belmont | 4/12/15 | 2283 | 641 | 28.08 | 31.1 |
| 2BLT-09 | Belmont, Belmont South | 25/9/15 | 2269 | 540 | 23.80 | 25.5 |
| 2BLT-10 | Blacksmiths, Marks Point, Pelican, Belmont South | 13/11/15 | 2319 | 754 | 32.51 | 35.2 |
Gorokan (NSW)
This part of the NSW Central Coast is another of the first band of suburbs to roadtest FTTN services.
It encompasses suburbs including Kanwal, Tuggerawong, Wadalba, Wyongah, Hamlyn Terrace, Warnervale, Woongarrah, Charmhaven, Gorokan, Lake Haven, Toukley, Canton Beach, Norah Head, Noraville and the Budgewoi Peninsula.
It is seeing a slightly higher median take-up rate of 33.04 percent than the cluster of suburbs around Belmont.
| Rollout ID | Location | Ready for Service | Total Premises | Activated | Take-up rate (%) | Take-up + Pending Orders (%) |
| 2GRK-01 | Kanwal, Tuggerawong, Wadalba, Wyongah, Hamlyn Terrace | 9/10/15 | 2997 | 1105 | 36.87 | 39.9 |
| 2GRK-02 | Hamlyn Terrace, Warnervale, Woongarrah, Charmhaven | 30/10/15 | 2515 | 892 | 35.47 | 38.6 |
| 2GRK-03 | Gorokan, Lake Haven, Charmhaven | 13/11/15 | 3916 | 1231 | 31.44 | 35.2 |
| 2GRK-04 | Gorokan, Lake Haven, Toukley, Canton Beach | 20/11/15 | 4016 | 948 | 23.61 | 26.7 |
| 2GRK-05 | Canton Beach, Norah Head, Noraville, Toukley, Budgewoi Peninsula | 20/11/15 | 4178 | 981 | 23.48 | 27.0 |
| 2GRK-06 | Kanwal, Warnervale, Hamlyn Terrace | 20/11/15 | 2682 | 929 | 34.64 | 38.6 |
Boolaroo (NSW)
The “2BLR” area suburbs sit to the west of Newcastle and Lake Macquarie.
The median take-up rate is 21.6 percent, though take-up in Cameron Park is 38.2 percent, putting it among the most successful early FTTN precincts.
| Rollout ID | Location | Ready for Service | Total Premises | Activated | Take-up rate (%) | Take-up + Pending Orders (%) |
| 2BLR-01 | Cameron Park | 25/12/15 | 1675 | 641 | 38.27 | 43.2 |
| 2BLR-02 | Cameron Park, Edgeworth, Holmesville, Killingworth, Barnsley | 25/12/15 | 2157 | 735 | 34.08 | 38.7 |
| 2BLR-03 | Booragul, Marmong Point, Speers Point, Teralba, Boolaroo | 1/1/16 | 2376 | 401 | 16.88 | 20.3 |
| 2BLR-04 | Boolaroo, Speers Point, Argenton | 1/1/16 | 2263 | 498 | 22.01 | 25.4 |
| 2BLR-05 | Edgeworth, Argenton | 1/1/16 | 2660 | 564 | 21.20 | 24.7 |
| 2BLR-06 | Seahampton, West Wallsend, Minmi | 1/1/16 | 1281 | 214 | 16.71 | 20.7 |
Hamilton (NSW)
This consists of 14 “2HAM” coded areas covering former industrial-belt Newcastle suburbs such as Kooragang, Tighes Hill, Carrington, and inner parts of Newcastle such as the city areas, Cooks Hill and the beach suburbs like Merewether.
These areas were declared ready to carry retail services in late January and early February 2016. Take-up rates are in the high single digits, or double digits if you take into account pending orders.
This may be a function of the data as much as anything: the data was pulled on 16 March, providing scant time to show any sort of activations growth.
| Rollout ID | Location | Ready for Service | Total Premises | Activated | Take-up rate (%) | Take-up + Pending Orders (%) |
| 2HAM-01 | Kooragang, Tighes Hill, Carrington | 22/1/16 | 2041 | 299 | 14.65 | 20.2 |
| 2HAM-02 | Newcastle West, Newcastle | 22/1/16 | 1526 | 92 | 6.03 | 9.2 |
| 2HAM-03 | The Hill, Newcastle | 5/2/16 | 1347 | 88 | 6.53 | 11.4 |
| 2HAM-04 | Newcastle East, Newcastle | 5/2/16 | 2064 | 85 | 4.12 | 8.9 |
| 2HAM-05 | Cooks Hill, Newcastle West, The Hill, Bar Beach | 22/1/16 | 1828 | 187 | 10.23 | 15.6 |
| 2HAM-06 | Cooks Hill, The Junction | 26/2/16 | 2484 | 12 | 0.48 | 5.4 |
| 2HAM-07 | Merewether | 29/1/16 | 2313 | 151 | 6.53 | 13.5 |
| 2HAM-08 | Merewether, Merewether Heights, Adamstown | 29/1/16 | 3209 | 190 | 5.92 | 12.3 |
| 2HAM-09 | The Junction, Hamilton South | 29/1/16 | 2605 | 143 | 5.49 | 9.4 |
| 2HAM-10 | Hamilton, Broadmeadow | 5/2/16 | 1808 | 135 | 7.47 | 12.8 |
| 2HAM-11 | Hamilton, Hamilton North, Broadmeadow | 5/2/16 | 1598 | 127 | 7.95 | 16.4 |
| 2HAM-12 | Maryville, Wickham, Islington | 5/2/16 | 2684 | 178 | 6.63 | 14.8 |
| 2HAM-13 | Hamilton East, Newcastle West, Wickham, Hamilton | 29/1/16 | 1336 | 50 | 3.74 | 7.3 |
| 2HAM-14 | Newcastle West, The Junction, Hamilton East | 29/1/16 | 1322 | 53 | 4.01 | 8.8 |
Morisset (NSW)
The dataset contains a small amount of take-up information on the suburbs around Morisset on the west side of Lake Macquarie.
These include Dora Creek, Bonnells Bay, Windermere Park, Brightwaters, Mirrabooka, Morisset, Morisset Park, Silverwater, Sunshine, Yarrawonga Park, Balcolyn and Cooranbong.
These areas are new, and the data appears to be incomplete. Take-up again is single-digit, but like Morisset they had barely been declared ready for service when this data was captured.
| Rollout ID | Location | Ready for Service | Total Premises | Activated | Take-up rate (%) | Take-up + Pending Orders (%) |
| 2MRS-01 | Dora Creek, Morisset, Bonnells Bay | 5/2/16 | 2588 | 108 | 4.17 | 9.2 |
| 2MRS-02 | Bonnells Bay, Brightwaters, Mirrabooka, Morisset Park, Silverwater, Sunshine, Windermere Park, Yarrawonga Park, Balcolyn | 4/3/16 | 3569 | 0 | 0 | 4.9 |
| 2MRS-03 | Morisset, Cooranbong | 4/3/16 | 2808 | 0 | 0 | 2.9 |
Bundaberg (QLD)
The only non-NSW statistics on FTTN take-up come from the “4BBE” areas in Bundaberg and surrounds.
Ready for service in the nine FTTN service areas represented occurred in December 2015. Take-up is more modest than NSW suburbs that have had FTTN connections around for a similar time.
However, with pending orders taken into account, the suburbs of Avenell Heights, Bundaberg South, Kepnock and Ashfield appear to have cleared 20 percent take-up.
| Rollout ID | Location | Ready for Service | Total Premises | Activated | Take-up rate (%) | Take-up + Pending Orders (%) |
| 4BBE-01 | Bundaberg Central | 11/12/15 | 948 | 11 | 1.16 | 2.4 |
| 4BBE-02 | Kalkie, Rubyanna, Bundaberg East | 11/12/15 | 2673 | 274 | 10.25 | 17.9 |
| 4BBE-03 | Walkervale, Norville | 11/12/15 | 2464 | 250 | 10.15 | 16.7 |
| 4BBE-04 | Thabeban, Walkervale, Avenell Heights | 11/12/15 | 2974 | 343 | 11.53 | 19.0 |
| 4BBE-05 | Avenell Heights, Bundaberg South, Kepnock, Ashfield | 11/12/15 | 3236 | 418 | 12.92 | 21.3 |
| 4BBE-06 | Millbank, Svensson Heights, Bundaberg West | 25/12/15 | 2272 | 126 | 5.55 | 10.2 |
| 4BBE-07 | Gooburrum, Bundaberg North | 25/12/15 | 3044 | 259 | 8.51 | 14.5 |
| 4BBE-08 | Bundaberg South, Bundaberg Central | 25/12/15 | 1812 | 83 | 4.58 | 8.0 |
| 4BBE-09 | Kensington, Norville, Svensson Heights, Bundaberg West | 25/12/15 | 1491 | 81 | 5.43 | 9.5 |


_(28).jpg&h=140&w=231&c=1&s=0)


_(20).jpg&h=140&w=231&c=1&s=0)


 iTnews Benchmark Awards 2026
 iTnews Executive Retreat - Security Leaders Edition
 iTnews Cloud Covered Breakfast Summit
 The 2026 iAwards






_(1).jpg&h=140&w=231&c=1&s=0)


