Researchers at Monash University have developed what they claim is Australia’s first high-resolution vegetation map to inform bushfire prevention activities, agriculture planning and pollution management.
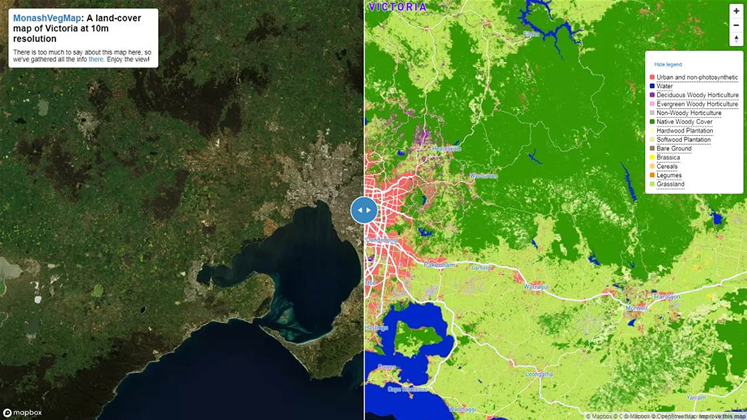
Over 4300 images from the European Space Agency’s Sentinel-2 satellite were stitched together to create the map using machine learning model capable of identifying and differentiating separate elements in an image, known as a temporal convolutional neural network (TempCNN).
A year’s worth of images was analysed using the open source TempCNN to understand how vegetation changes throughout the year, as well as to remove cloud cover from the resulting mosaic of 37 tiles, each covering a 100km by 100km area.
In the resulting map, each ‘pixel’ represent a 10m by 10m space, offering 25 times more detail and definition than the current vegetation maps produced by the federal government.
Project lead, Dr Francois Petitjean from the university’s Faculty of IT, said that similar earth observation satellites have been informing large-scale agricultural, environmental and climate-related decisions for years.
“But the pictures we used to see were largely static and unreliable,” he said.
“We’re entering a new era in Earth observation, with latest-generation satellites starting to produce images of Earth frequently, in high resolution, and at no charge to end users.
“We now have an unprecedented opportunity to monitor the dynamics of our region – and country – over time, and establish a course of action that reflects the changing nature of the environment.”
For example, with fire management the map can be used to know the condition of trees and grasslands (in particular, their water content and biomass), to produce high-quality fuel-load maps that can be used to model how bushfires spread and how effective prescribed burns can be conducted.
Vegetation cover also heavily impacts on the ground’s ability to absorb water, meaning the map can be used to predict water levels after rain events - offering the capability to show when the soil becomes waterlogged and prone to flooding.
Different kinds of privately and publicly owned vegetation also dictate how well an urban environment absorbs different types of pollution.
However, the map does have its limitations for now, Petitjean said on his blog. For starters, the period of study was slightly misaligned with the Victorian agricultural growing season, which particularly impacts on the classification of bare soil and grassland areas.
Sandy areas with sparse plant covering may also have underrepresented amounts of vegetation.
However, he added that the researchers had chosen to publish the map now and continue to work on improving it and extending it over time, with a view to extend its coverage beyond Victoria.
“This very colourful map shows great potential for refined modelling of the state’s vegetation, highlighting possible improvements that may be required. We’re currently looking into how we can replicate this for other states and territories in Australia,” he said.


.jpg&h=140&w=231&c=1&s=0)

.png&w=100&c=1&s=0)


 SAP NOW AI Tour ANZ
 Forrester's AI Forum Sydney
 The 2026 iAwards
.jpg&w=120&c=1&s=0) Integrate 2026
Integrate 2026
 Security Exhibition & Conference


_(1).jpg&h=140&w=231&c=1&s=0)