
ANZ Banking Group reduced CPU utilisation on its twin Z13 mainframes, cutting the cost of running the machines by millions of dollars a year.

David McPherson, an architect at the group, revealed the savings today at Splunk.Conf 18 in Orlando, Florida.
McPherson delivered a session titled “Discover Your Hidden Million Dollar Mainframe Treasure! – Monitor and Reduce your CPU peaks” in which he explained that the bank used Splunk to monitor its Unix and Windows application estates, but was not able to understand mainframe performance until recently.
ANZ’s deal with IBM sees it able to consume 3100 MSUs [million service units], IBM’s unit for billing mainframe processor use. The machines can deliver more power, but if ANZ taps those extra resources it has to pay more for the privilege.
McPherson said he therefore took on the job of managing costs for the Z13s as “a hobby”. Encounters with Splunk users on other teams led him to consider its application to the mainframes and early experiments quickly produced data that revealed CPU utilisation.
IBM doesn’t charge in every instance agreed capacity is exceeded, but McPherson quickly found that there were times when ANZ regularly went over.
Those occasions were quite predictable: the bank has an overnight peak when batch jobs run, then another peak during the business day.
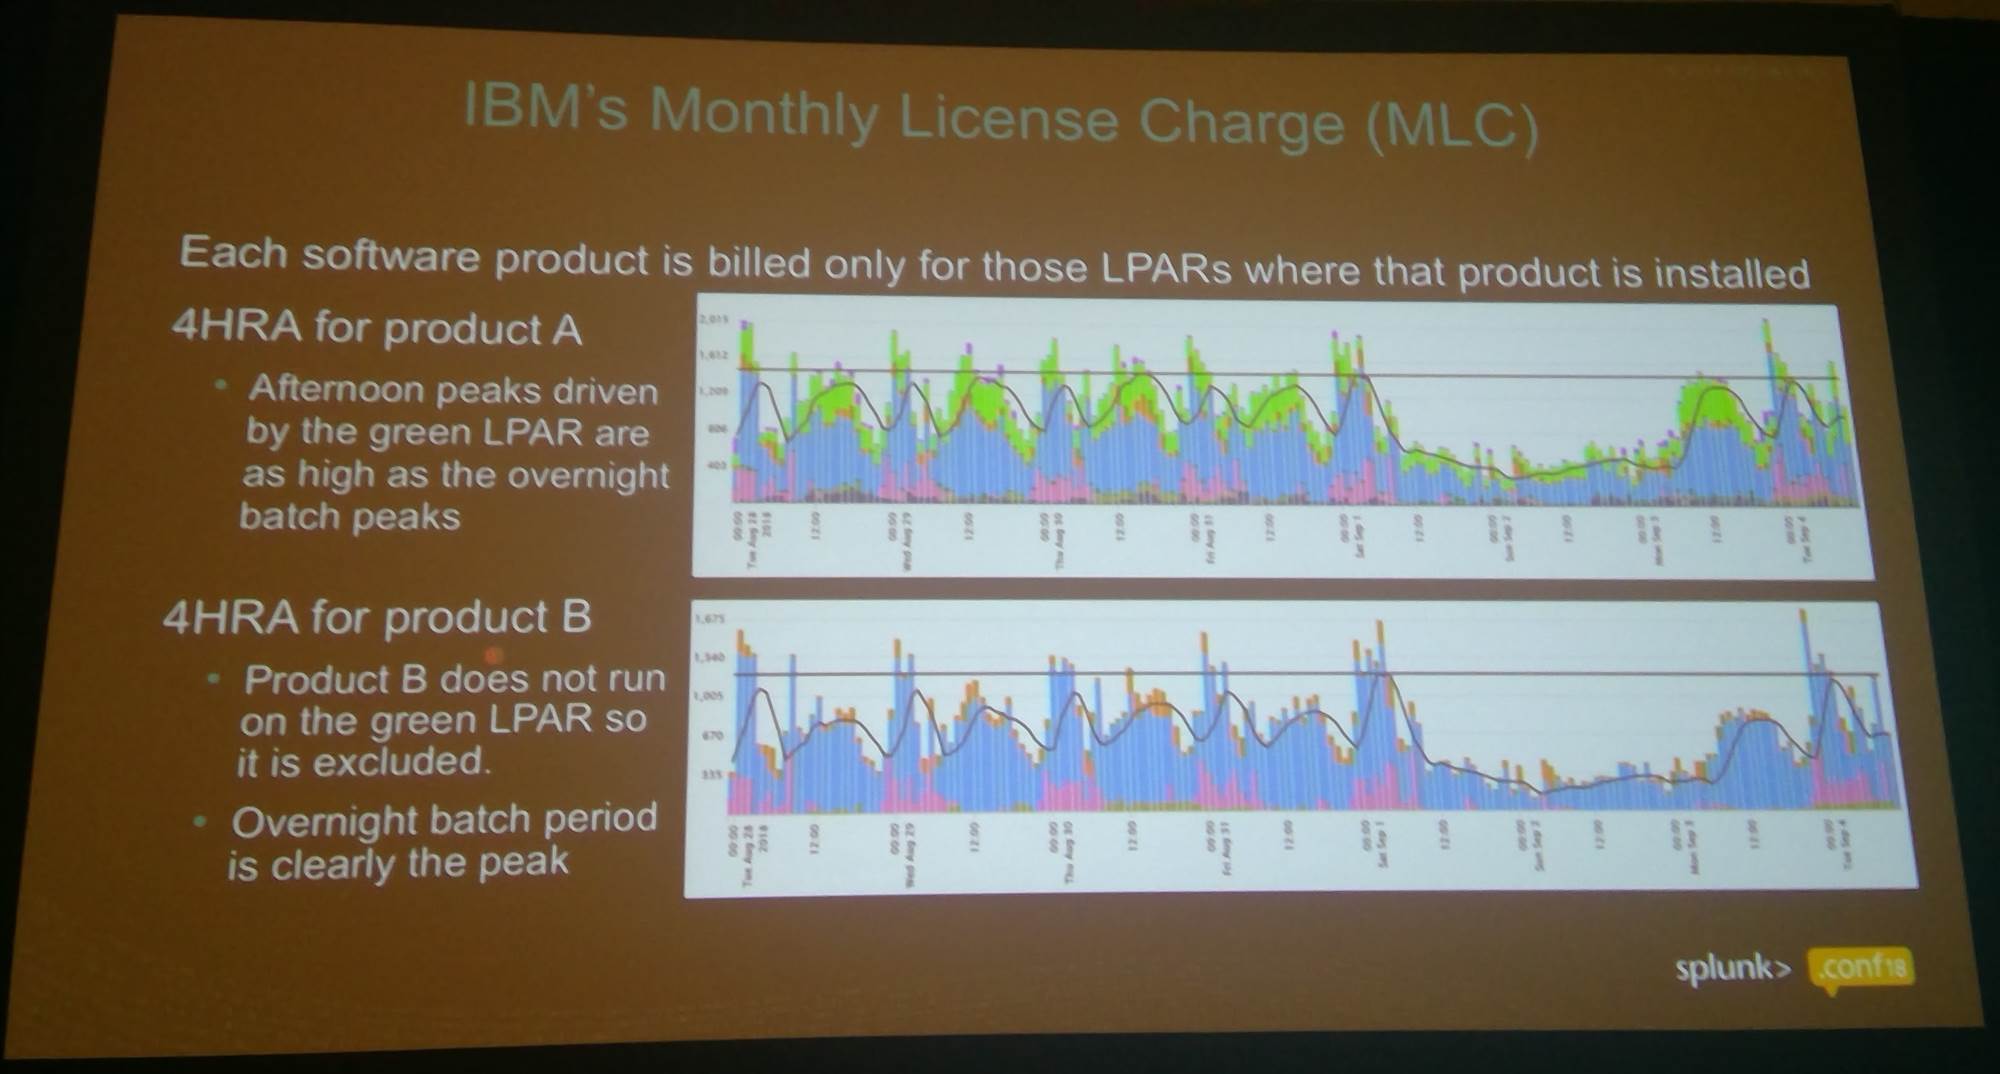
Measuring CPU usage was complicated by the fact ANZ’s mainframes operate “logical partitions” (LPARs) - effectively virtual machines that each consume their own resources and each run dedicated workloads.
McPherson therefore needed to measure each LPAR’s behaviour, rather than that of the whole mainframe.
His analysis of LPAR performance showed which exceed licenced CPU capacity.
A first step was some remediation of the resource-hungry apps. McPherson said his team made improvements to code, made sure they compressed data and made sure they didn’t run redundant jobs. One of which, ironically, was IBM’s own reporting on CPU utilisation, which was duplicated in Splunk.
Next came an investigation of which workloads were taking the group over the top, and when.
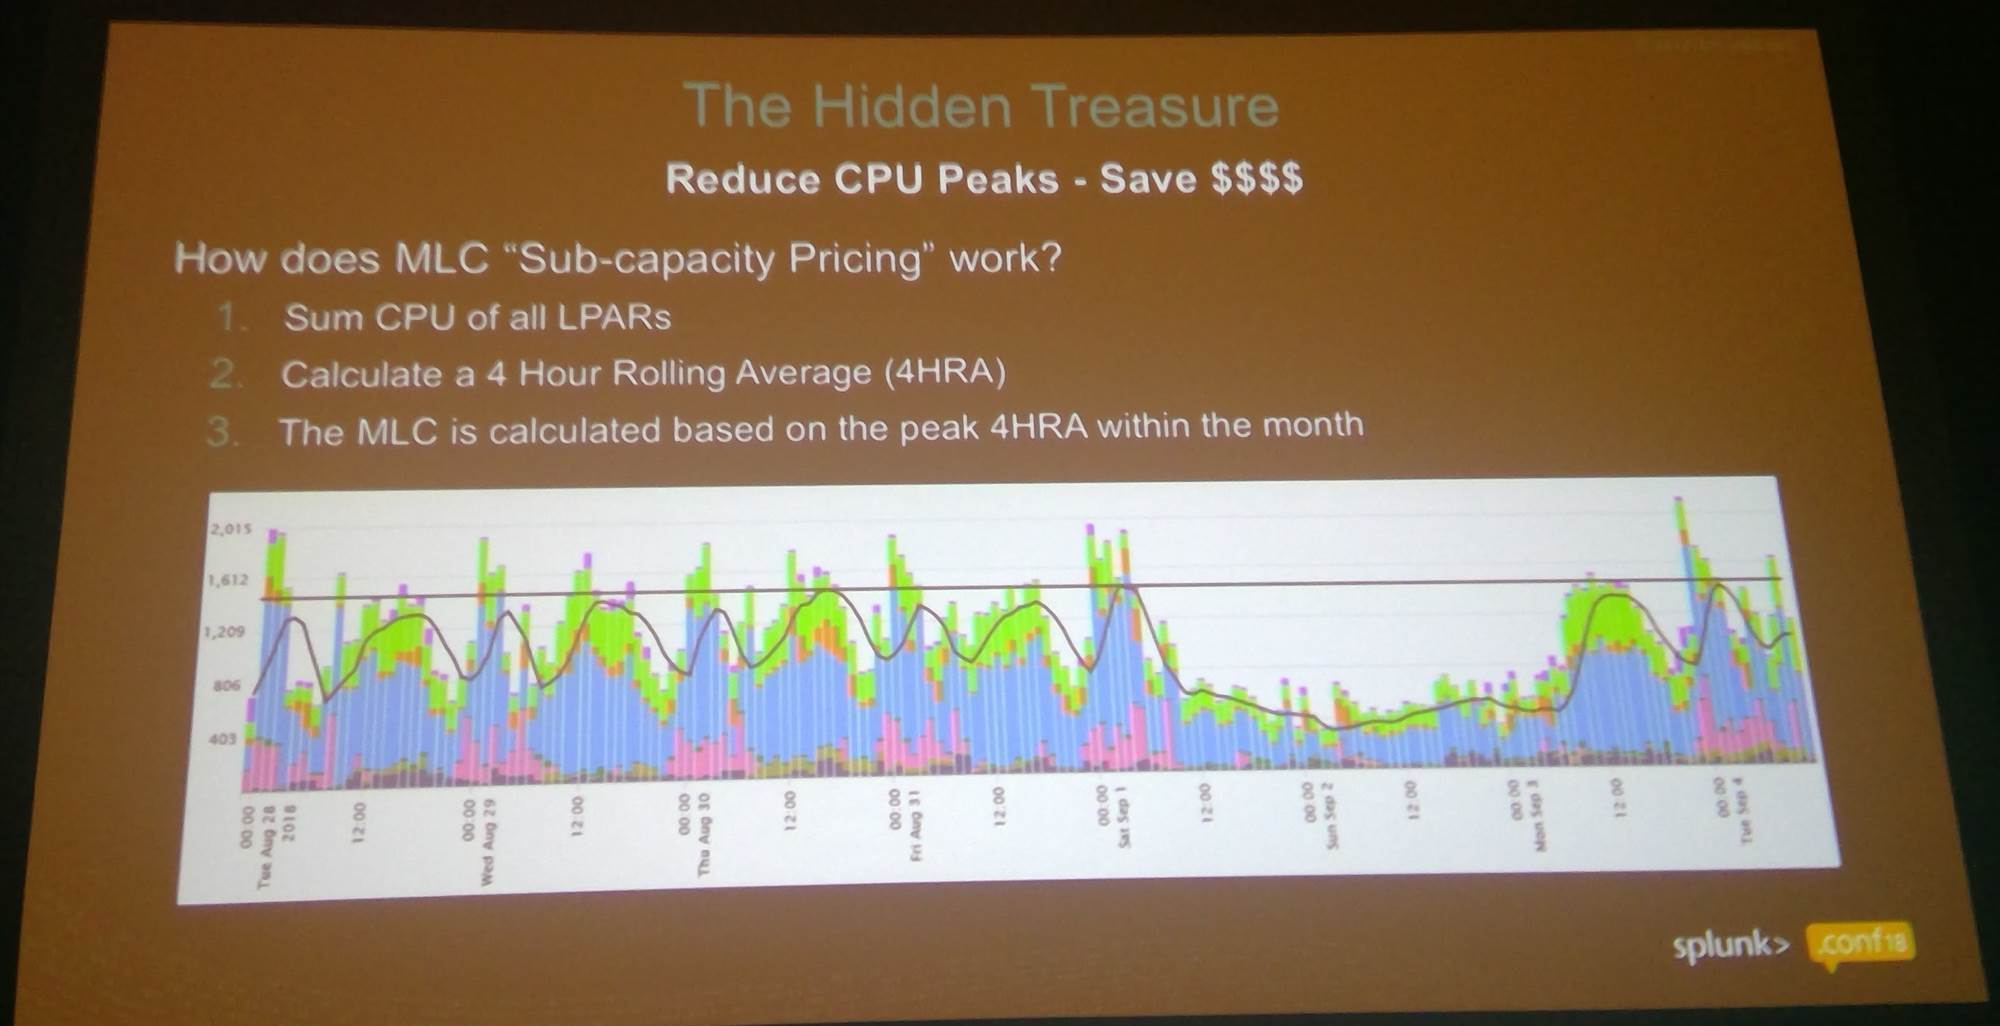
Visualising CPU utilisation data in four-hour chunks. The straight black line is the limit of usage at a fixed price, while the wobbly line is a rolling four-hour average of actual consumption.
A significant culprit turned out to be batch jobs that didn’t necessarily need to run at peak times, or could be postponed.
“The biggest savings came from dynamic batch delays,” McPherson said. “I would find jobs that runs in my 4:00 AM peak, but users only read the report it generates at 9:00 AM.”
He now runs such jobs at off-peak times, around 7:00AM, which leaves time for manual intervention if something goes awry.
He’s also used automation to detect if CPUs exceed usage thresholds, then re-scheduled batch jobs to times they can run without costing ANZ more money.
“I had ten different peaks to manage so I had ten different opportunities to save money,” he said.
A 25-year mainframe veteran, McPherson seemed a little abashed at his achievements and told attendees his feats could easily be replicated.
He recommended other Z-series users seeking to save money should start by visualising CPU consumption data, then consider a business problem that can be solved; “otherwise it is coloured lines on a screen.”

.jpg&h=140&w=231&c=1&s=0)
.jpg&h=140&w=231&c=1&s=0)

.jpg&h=140&w=231&c=1&s=0)
.png&w=100&c=1&s=0)


 iTnews State of Data & AI Breakfast
 Forrester's AI Forum Sydney
 The 2026 iAwards
.jpg&w=120&c=1&s=0) Integrate 2026
Integrate 2026
 Security Exhibition & Conference


_(1).jpg&h=140&w=231&c=1&s=0)