Demand for ICT professionals across Australia increased by one percent in March but remains some 18 percent below demand experienced the same time last year, Government data has revealed.

According to the Department of Employment Education and Workplace Relations' (DEEWR) latest skilled internet vacancy indices (IVI), there were a total of 13,069 ICT vacancies throughout Australia last month.
The Skilled IVI measures ICT vacancies from Jan 2006 to March 2012 based on online job listings on Seek, My Career, CareerOne and Australian JobSearch.
For comparison, across all tracked professions, vacancies increased 0.7 percent in December but is still down by 7.9 percent year-on-year.
The overall Skilled IVI increased in March 2012 (up by 0.9 percent), the fourth consecutive monthly increase, with rises recorded across 14 of the 20 occupational groups.
The strongest increases were recorded for Engineers (up by 3.3 percent), followed by Jewellers, Arts and Other Trades Workers (2.5 percent), and Science Professionals and Veterinarians (2.1 percent).
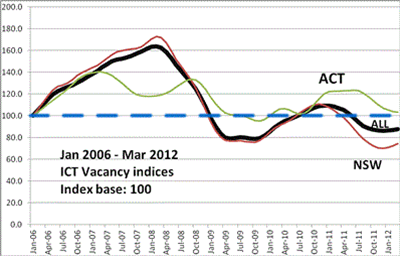
A five year perspective of vacancies for all states and the Australian Capital Territory shows ICT vacancies are well down on a peak period around February 2008.
DEEWR sets a base index as 100 for the number of employment ads in January 2006, and noted that in February 2008 the number of vacancies peaked at 163.7 (or 63.7 percent higher than January 2006).
There was a second smaller spike in December 2010, registering an overall index of 109.3.
Overall the vacancy index for ICT professionals was just 87.8 (or 87 percent of the level at Jan 2006). With exception of the South Australia, ACT and NT, all States saw gradual increases in ICT vacancies in March 2012.
While NSW has the most vacancies and its index is on the rise, demand for ICT jobs is 73 percent of the number for the same period last year.
Reliant on the public sector, the ACT demand index for ICT professionals continues to decline. Though it is 103.8 (or 3.8 percent) above the demand for January 2006, its index value at the same time last year was 122.7.
|
|
Feb 2011 |
Mar 2011 |
Actual vacancies (March 2012) |
|
Aust |
86.9 |
87.8 |
13,069 |
|
NSW |
72.3 |
74.3 |
5,249 |
|
VIC |
89.8 |
90.3 |
3,412 |
|
QLD |
94.6 |
96.1 |
1,855 |
|
SA |
94.6 |
92.9 |
340 |
|
WA |
114.6 |
102.0 |
999 |
|
TAS |
99.1 |
104.9 |
29 |
|
NT |
178.9 |
172.4 |
37 |
|
ACT |
103.8 |
103.2 |
1,013 |


_(23).jpg&h=140&w=231&c=1&s=0)
_(20).jpg&h=140&w=231&c=1&s=0)


_(26).jpg&w=100&c=1&s=0)
 iTnews Executive Retreat - Security Leaders Edition


_(1).jpg&h=140&w=231&c=1&s=0)


